Every page and feature in SmartBorsa: what it is, how to reach it, how to use it, and what happens to your data when you press. With a screenshot of each feature.
An Arabic-first portfolio manager for the Egyptian Exchange (EGX) with an equivalent English (LTR) interface. It runs entirely on your device with no server or account; your data lives in your browser. A cloud account is optional and gives you end-to-end-encrypted sync between devices.
What it does not do: it places no real orders, does not connect to your brokerage account and never touches your money. It is a tracking and analysis tool; information is for guidance, not investment advice. Prices come from an unofficial source and are delayed about 15 minutes per exchange rules, so their age is always shown.
Principles you will see everywhere:
Numbers are true to your own position: a stock bought today does not "lose" yesterday's drop.
What cannot be computed says why and offers one next step (e.g. "record your first deposit").
Rebuilt history from your records is marked as an estimate.
Demo money (the Virtual Market) is always marked and kept apart from real money.
2Quick start
Welcome page (/welcome/): a new visitor with no history lands here. Press "Try the app free" to open the app without an account, or "I have an account"/"New account" at the bottom of the page.
"Your portfolio is empty" screen: on first open it asks for your first portfolio's name and offers "Load sample data to explore" (a sample portfolio marked "Sample data, not real money").
Add your first stock: "Stocks → My Stocks → Add a stock", or type the trade as a sentence from the quick-action button: "bought 200 shares COMI at 45.5".
Record your deposit in the Cash wallet so real returns (XIRR and TWR) are computed honestly.
Refresh prices with the "Refresh prices" button to see what your portfolio did today.
3The interface
Navigation
Desktop: a side rail with icons and labels: Home, Stocks, Cash, Calendar, Market, Analysis, Lab, then Settings and Account at the bottom. Each section's pages appear as tabs inside it.
Phone: a bottom bar (Home, Stocks, Search, Analysis, More); "More" holds the rest: Cash, Calendar, Market, Settings, Account.
Top bar: search, the market button (market name and open/closed status), language toggle, refresh prices, price alerts, and the quick-action button.
Search and shortcuts
Shortcut
Action
Ctrl/⌘ + K or /
Open search across pages, stocks and actions
1 … 8
Jump to the first eight sections in menu order (outside input fields)
?
Show the shortcuts list
Esc
Close search and dialogs
Click a stock on the map, movers or alerts
Opens the stock page
Quick-action button (+)
From the appThe quick-action sheet: the trade sentence and the buy, deposit, dividend and watchlist buttons.
One sheet with: "type your trade as a sentence" (example: bought 200 shares COMI at 45.5, then "Review" before saving), and buttons: Buy a stock, Deposit / withdraw, Record a dividend, Add to watchlist, Refresh prices now. To sell: "Stocks → Positions" then "Sell", or type "sold 100 shares …".
Market button and multiple markets
From the appThe market panel: four markets with their status, and the total of all your portfolios in a base currency.
The top-bar market button shows the market name and its status (open/closed). Pressing it opens a panel with four markets (Egypt, UAE, Saudi Arabia, United States), each with its currency and status, the total of all your portfolios in a base currency you choose, and "Details" (each market's share, exchange rates, source). Choosing a market where you have no portfolio asks "You have no portfolio in …"; choose "Create portfolio" or "Cancel" (Esc also cancels). Each portfolio has one market and currency that cannot change after creation. Tax, the Virtual Market and alerts are Egypt-only; elsewhere they read "not available".
Saving and privacy
Every change is saved instantly in your browser. "Hide amounts" replaces every figure with dots so you can check in public. PIN lock and encryption are optional (see Account).
4App pages
4.1
Welcome page
Overview
An introduction for new visitors with a demo calculator and the sign-in form.
Access
opens automatically for a visitor with no history (no account, PIN or finished setup); or go to /welcome/. ?app enters the app directly.
Components
Hero with an app screenshot; tabs "My Stocks / Virtual Market / Lab" with real screenshots; a calculator (symbol, shares, buy price, current price); FAQ; a "Sign in | New account" card.
Steps
Try the calculator (profit after a 0.15% commission and the break-even price, nothing saved) → "Try the app free" or sign in.
System effects
The sign-in form hands your details once to the app via tab storage (sb_handoff), which signs you in or creates the account with its normal flow.
Tips
On a phone the "Try the app free" button stays pinned at the bottom after the hero.
4.2
Home (dashboard)
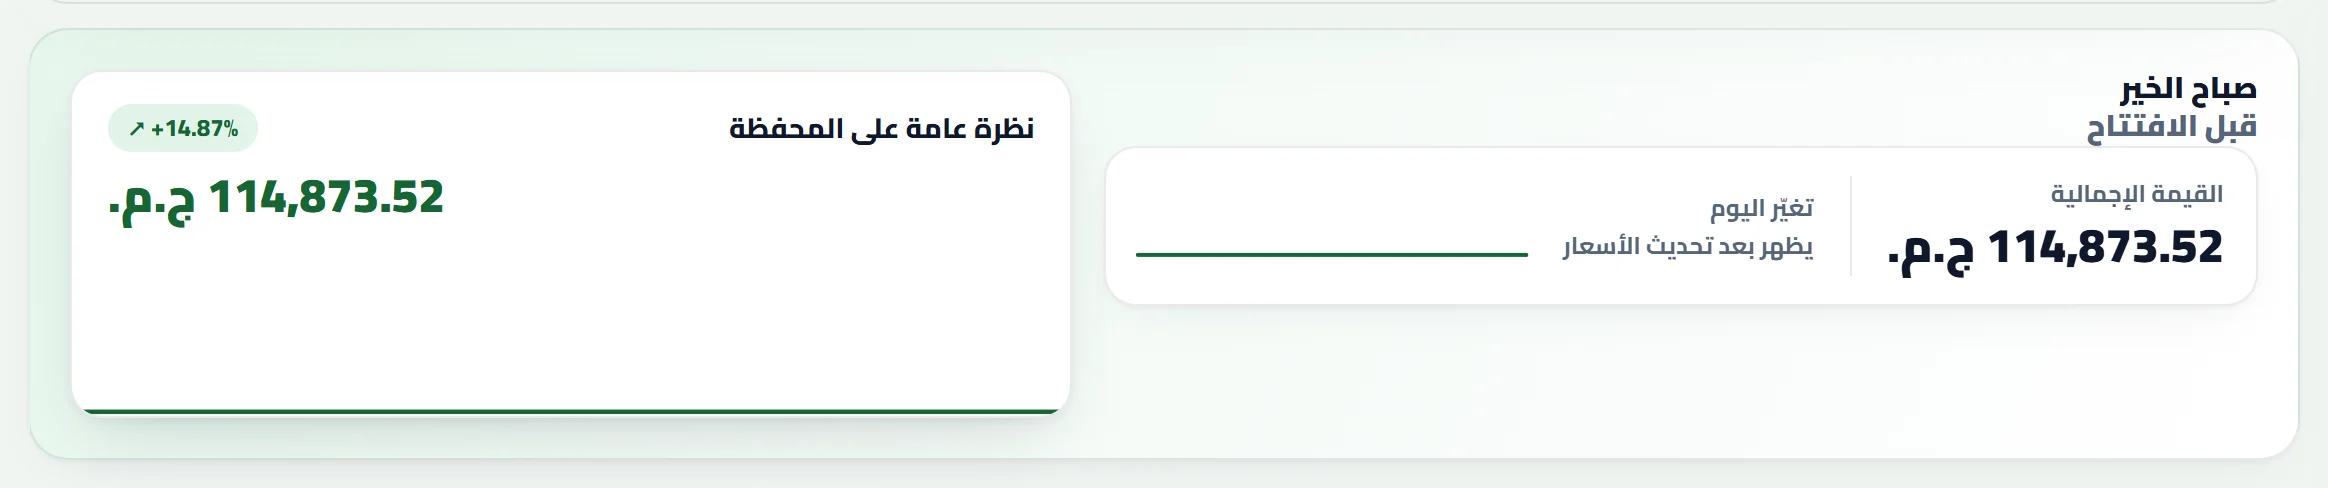
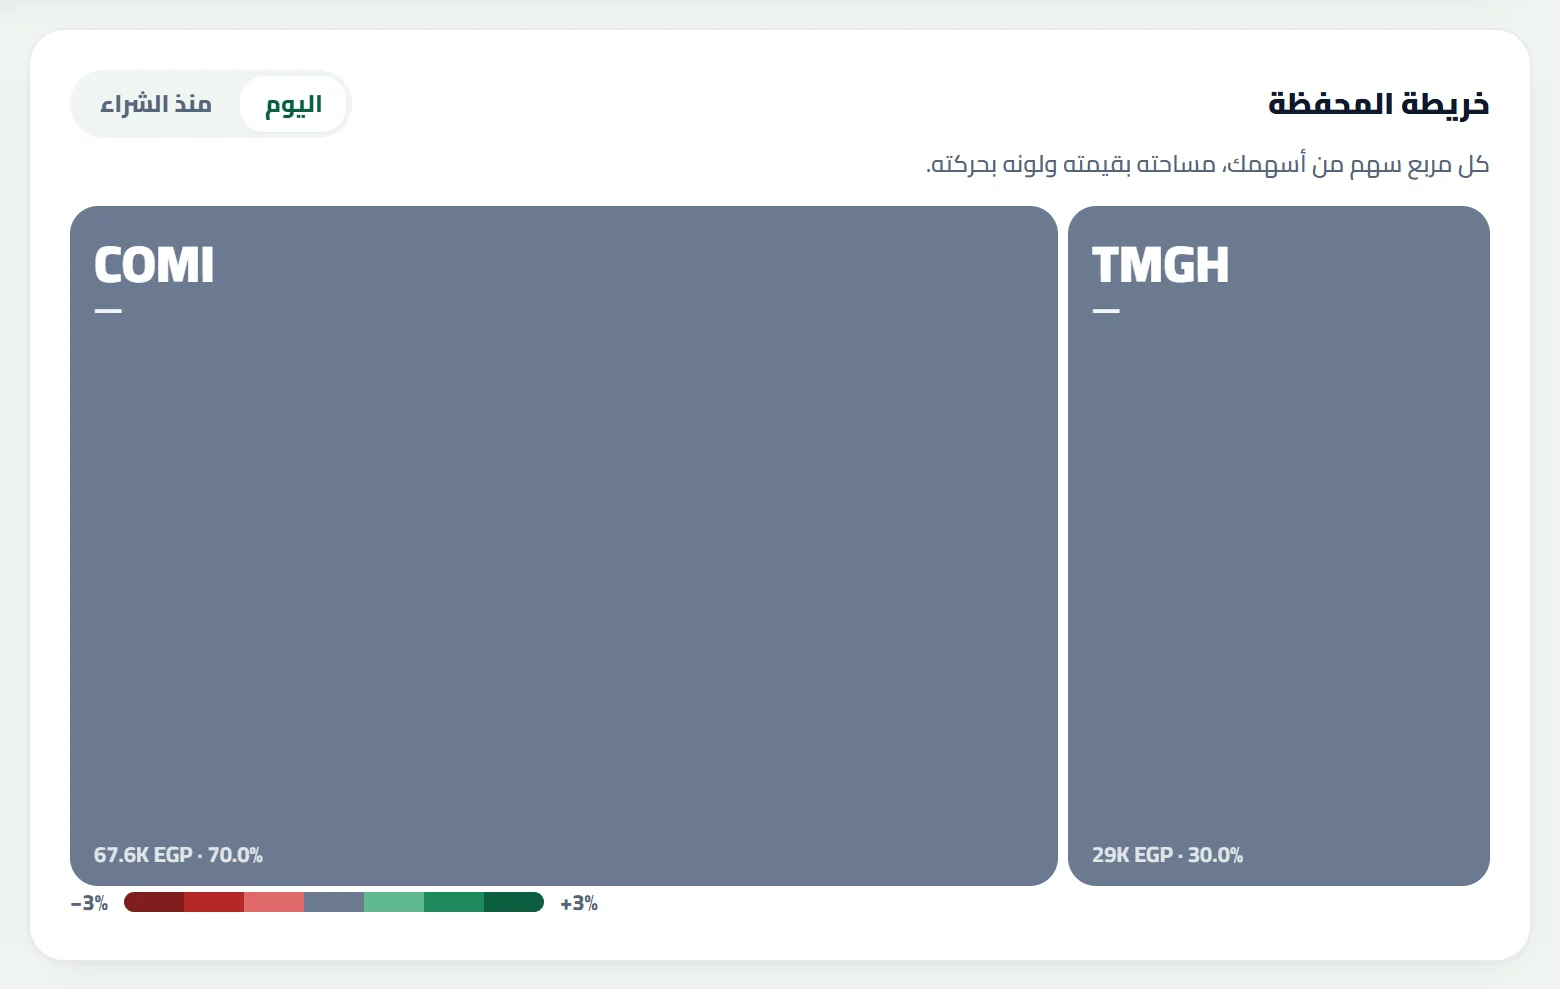
From the appHome: total value, stocks, cash and today's change.From the appPortfolio map: each square's area is the stock's value, its colour is its move.From the appWho moved your portfolio today, in pounds.
Overview
"How am I doing now": total value, today's change, value curve, then live blocks.
Access
"Home" (first item).
Components
Greeting ("Good morning/evening" + "Add your name"); total value, stocks and cash; value curve against what you deposited with ranges (month, 3 months, 6 months, year); session status (open/pre-open/closed with progress); blocks: Top gainers, Watchlist, Portfolio map (colour by "today" or "since purchase"), Who moved your portfolio, Portfolio allocation, Price targets, Needs your attention; a "Customise Home" button.
Steps
"Refresh prices" to show the last session's move
pick the curve range
open "Customise Home" to hide or reorder blocks with arrows
"Done".
System effects
Your choices are saved on this device only. Nothing about your investment data changes.
Tips
A stock whose price jumped more than usual is excluded from the session move (usually a bonus issue or split) with a note: record it under "Dividends". The curve starts today and adds one point each day you open the app.
4.3Stocks
4.3.1
My Stocks
From the appYour stock cards with a 90-day price line and your average-cost line.
Overview
A card per stock with a 90-day price line and a dotted line at your average cost.
Access
"StocksMy Stocks".
Components
"Add a stock", sort by (value, today, profit %, A–Z), a card per stock (shares, average buy, profit after commissions), "More in Stocks".
Steps
Tap a card for the stock page → "Add a stock" for the buy form.
System effects
The sort is saved as your default (settable in Settings).
Tips
A stock without a price archive shows "No price archive yet".
4.3.2
Positions table
From the appBreak-even price per position after commission and stamp duty.
Overview
Portfolio stocks with details and prices.
Access
"StocksTable".
Components
Search by symbol/name, sector filter, export a shareable performance card, export CSV, export a full Excel workbook (stocks, sales, dividends, liquidity, log), "Archive today's prices"; per stock: weight, profit/loss, break-even, stop and target; buttons: stock page, Sell, Update price, Edit, Delete; a "Break-even price per position" table.
Steps
search or filter
"Update price" for a manual price
"Sell" to sell part or all
"Edit"/"Delete".
System effects
"Update price" is manual only and changes neither quantity nor average. "Edit" changes the recorded stock data without adding or removing cash. "Sell" adds the proceeds to cash and logs a trade under "Sales".
Tips
Break-even includes buy and sell commission and stamp tax. "Archive today's prices" stores today's close to support signals and levels.
4.3.3
Add / edit stock form
From the appThe add-stock form: symbol, quantity, price, commission, stop and target.
Components
Asset type (stock/fund), symbol (pick from EGX or type), company name, sector (+ add a new sector), shares, buy price, market price, commission rate (default about 0.155%), stop-loss and take-profit (optional), entry reason (journal), and a "What if I complete this trade?" card (weights of the stock and sector and cash after buying, a suitable size for a chosen risk, "Suggest a −7% stop").
Steps
choose the stock
enter quantity and price
check "Trade cost" and "Expected balance"
"Save stock data".
System effects
A purchase is deducted from cash; if cash is not enough you see "Insufficient cash balance" (deposit or lower the quantity). Buying a stock you already hold merges the quantity and recomputes the average. Funds do not auto-update prices (update them manually).
Tips
Set a stop and a target to get browser notifications when either is reached.
4.3.4
Sectors and rebalancing
From the appThe rebalancing tool: current and target weight and a recommendation per sector.
Overview
How your money is spread across sectors, plus a rebalancing planner.
Access
"StocksSectors".
Components
Sector allocation chart; a "Performance comparison" tab (all your sectors as a race of bars ranked by return since buying, gain in EGP or today's move, with a sentence naming the best, the weakest and the gap between them, buttons to choose the sectors you want to compare: "All", "Best 3", "Weakest 3" and "Clear selection", a dashed line for the whole portfolio, and a table of exact figures; your measure and choices stay on your device); a "Portfolio map" tab (portfolio, sectors and cash); a table with sector, value, current weight, target weight, recommendation ("Buy by…"/"Sell by…"/"Balanced"); sum of weights; "Refresh recommendations"; and a "What should I buy now?" card (available amount, "All available cash", "Calculate suggestion", "Execute").
Steps
enter each sector's target weight (total 100%)
read the recommendation
in "What should I buy now?" enter an amount
"Calculate suggestion"
"Execute" to prepare the purchase.
System effects
Targets are saved; "Execute" does not buy by itself, it opens the buy form. The suggestion never proposes selling a winning position.
Tips
Guidance only, not advice; it ignores market news.
4.3.5
Sales
From the appTrading statistics from your closed trades.
Overview
The log of closed trades and your trading statistics.
Access
"StocksSales".
Components
Stats: trades, win rate, average win/loss, payoff ratio, expectancy, profit factor, best/worst trade, average holding time; the log table (date, stock, quantity, buy/sell price, commission, net, realised P/L, delete).
Steps
Fills automatically after each sale; "Go to Stocks" when empty.
System effects
"Delete from log" removes the log entry only. "Trade performance" and Tax read this log.
Tips
Under 10 trades is only a preliminary indication (the app says so).
4.3.6
Dividends
From the appDividend yield on your cost (Yield on Cost).
Overview
Cash coupons and bonus shares.
Access
"StocksDividends" or the quick action.
Components
Metrics (total cash, bonus shares, number of entries, cash dividend yield), "Record a new dividend", the log table, "Yield on Cost", "Estimated dividend calendar".
Steps
"Record a new dividend"
type (cash/stock)
stock
coupon per share, or stock-dividend ratio (e.g. 10% on 500 shares = 50 shares)
options: add to cash, or reinvest (DRIP)
"Record dividend".
System effects
Cash is added to liquidity if you choose so. A stock dividend adds shares and recomputes the average buy price (and is not counted as a loss in today's move).
Tips
The calendar is an estimate from your own past pattern, not a company confirmation.
4.4Cash wallet
4.4.1
Cash wallet
From the appHow your liquidity got here: deposits, withdrawals, purchases and sales.
Overview
Your liquidity and how it got here.
Access
"Cash".
Components
Available liquidity, deposited, withdrawn, dividends, "Deposit or withdraw", "Transfer to another portfolio", a "How your liquidity got here" flow (deposits, withdrawals, purchases, sales, dividends, fees, unrecorded difference), the moves list (filter: All / Deposit & withdraw / Trades / Dividends), CSV and Excel export.
Steps
"Deposit or withdraw"
type, amount, note
"Confirm".
4.4.2
Cash flow
From the appThe deposit and withdrawal form.
Components
Buttons "New deposit / withdrawal" and "Transfer to another portfolio"; totals (deposits, withdrawals, broker expenses, net capital deposited, balance); a table with edit and delete.
Steps
A withdrawal has a category: personal, or fees (subscription, custody, bank, other).
System effects
Anything other than "personal withdrawal" counts as a real investment cost and appears in broker expenses. A transfer moves liquidity between two portfolios of your account and updates the capital deposited in both. If the log does not match the capital you see a warning and "Reconcile log now".
Tips
An amount above the available cash is refused.
4.4.3
Tax
Overview
An estimated annual report.
Access
"CashTax" (Egypt only).
Components
The year; stamp-duty rates (buy/sell) and capital-gains tax (editable); total buy and sell value, estimated stamp duty, net realised profit, dividends; "Export report as CSV".
System effects
It is not a tax return; rates are defaults and the law changes (a notice is shown on the page). Stamp rates feed the break-even price.
Tips
Check the tax authority's or your broker's latest instructions before relying on it.
4.5
Calendar
From the appProfit calendar: every session coloured by the day's result.
Overview
Every trading session coloured by the day's result (excluding deposits and withdrawals).
Access
"Calendar".
Components
Green days, best day, hardest day, longest green streak, "Months summary".
Steps
Open a day to see its result and return.
System effects
Needs a daily snapshot of the portfolio; one point is added each day you open the app. It changes no data.
Tips
Profit/loss colours can be switched to blue/orange in Settings.
4.6Market
4.6.1
Market
EGX indices (prices delayed about 15 minutes) and how many stocks are on your watchlist. Access: "Market".
4.6.2
Watchlist
From the appThe watchlist: stocks you follow without owning.
Overview
Stocks you follow without owning.
Components
"Add a stock to watchlist" (name, price, buy target, note, optional CSV of old prices), a table (price when added, current, change, target, 30-day chart), buttons: details, add to portfolio, set an alert, remove; a "Price alerts and notifications" panel: enable browser notifications, auto-refresh every N minutes (pauses when the tab is minimised), add an alert (symbol, price, direction), active alerts and last fired.
System effects
Alerts are checked on every price refresh; browser notifications work while the app is open.
4.6.3
Explore a stock
Type any stock's symbol or name, then "Analyse now": price and data age, day and 52-week high/low, P/E, EPS, fair value and beta, technical analysis (moving averages, RSI, MACD, support and resistance), price history (month/6 months/year/5 years), latest news, and quick actions (add to portfolio, price alert, links to Mubasher, Investing and EGX). All for guidance.
4.6.4
Stock screener
Overview
Filters the exchange by P/E, P/B, dividend yield, liquidity and sector.
Components
Presets (high dividends, low valuation, high liquidity, large caps), detailed filters, "Reset filters", "Save filter" (up to 20, on your device), a sortable results table with "Analyse" and "Watch", "Show more".
Tips
A stock with no figure for a filter is excluded from it. The US list is the top 600 by market cap and says so.
4.6.5
Heat map
The whole market as a map: sector = block, stock = square, area by market cap or traded value, colour by day/month/year move. Map/List view, zoom into a sector, hover a square for details, an "owned/watched" mark, and "Analyse stock"/"Add to watchlist".
4.6.6
Events calendar
Earnings announcements, ex-dividend dates and payment dates. Scope: "My stocks and watchlist" or "Whole market", event type, horizon. Ex-dividend date: buy before it to qualify. Some earnings dates are estimates.
4.6.7
Fundamentals
Pick a stock (search or from yours) to see valuation, growth, profitability, financial health, size, and comparison with its sector median. Not every company has every figure; the available count is shown.
4.6.8
Stock news
Headlines from sources such as Reuters via the data source (not official exchange disclosures). "News about": the market or a stock, language (Arabic/English), refresh. Tap a headline to read it at its source.
4.6.9
Alert notifications
Notifications that reach you with the app closed. The server stores only the stock symbol, alert type and number, and knows nothing about your portfolio. Needs a signed-in account (and, on iPhone, adding the app to the Home Screen). "Turn on notifications", "Test notification", a price alert or a "strong move during the day" alert (1–30%), and a notification before earnings or the ex-dividend date. The number of price alerts is capped by your plan.
4.6.10
Compare stocks
Add up to four stocks and compare them with the EGX30/70/100 indices on one chart starting at 100, plus benchmarks (gold in EGP, USD in EGP, and inflation, whose rate you enter yourself), a returns table (day … year), and RSI, MACD and moving averages. Index lines are dotted because there is no free daily history for them.
4.6.11
Virtual Market
From the appThe virtual order ticket, with EGP 500,000 of virtual money.
Overview
Practice trading with EGP 500,000 of virtual money, completely isolated from your own.
Access
"MarketVirtual Market" (Egypt only).
Components
A "Demo account · Demo Mode" badge; total, profit since start, cash and market value; a virtual order ticket (buy/sell, symbol, quantity, "Max", live price, value, commission and balance after); virtual positions; trade history; statistics (win rate, realised profit, commissions, best/worst sale); account allocation with a concentration warning; "Reset virtual portfolio".
Steps
pick symbol and quantity
check the numbers
"Virtual buy"/"Virtual sell".
System effects
Live prices with a virtual commission. It is never included in your total assets, your backups or your sync. It is stored in your cloud account if you are signed in, otherwise on this device only. "Reset" restores 500,000 and clears positions and history.
4.7Analysis
4.7.1
Analysis
From the appYour real return: five measures and where it came from.From the appPortfolio pulse: concentration, diversification, protection and liquidity in one number.
Overview
Your real return, where it came from, and the portfolio pulse.
Components
Five measures: Simple, money-weighted MWR (XIRR), time-weighted TWR, compound annual growth CAGR, and a bank-certificate comparison (edit its rate); "Where your return came from" (unrealised, realised, dividends, commissions); Portfolio pulse out of 100 (concentration, sector diversification, stop-loss protection, liquidity) with a recommendation; "What do you measure here?".
System effects
Each figure says why when it cannot be computed: "Record your deposits", "Reconcile the liquidity log", "Widen your price archive". The pulse is informational, not advice.
4.7.2
Performance over time
Portfolio value against deposited capital, compared with the EGX30 index and a bank certificate (edit its rate). A daily snapshot taken automatically on each visit builds the history; it needs a few days.
4.7.3
Your trade performance
From the appYour trade performance: trading quality and activity.
A summary (total return, cumulative profit curve), trading quality (profit factor, expectancy, win rate, payoff, average win/loss), activity (trade count, size, holding time, commissions, longest win/loss streak), monthly profit, a profit/loss calendar (daily/weekly/monthly), per-stock performance (table or P/L) and CSV export. Periods: month … all. "How are these numbers computed?" explains the formulas. Built from the sales you recorded.
4.7.4
Signals
Overview
An educational tool applying a value strategy with dynamic rebalancing to your stocks. Not advice.
Components
Cards (accumulation opportunities, trim/take-profit, suggested cash, portfolio safety); a parameters panel (minimum margin of safety, suggested from your investor profile, "Apply"); a table with fair value, target weight, dividend yield, 52-week high and "Auto-fetch"; performance period; a recommendations table (strong accumulate / add / hold / trim) with signal score, archive confidence and "Try the decision"; Recurring support and resistance.
Steps
archive prices daily
enter fair value and target weight (manually or auto-fetch)
"Recalculate signals".
Tips
A longer archive gives higher confidence. A stock that falls because its fundamentals weakened may give a misleading "accumulate": review the company's news.
4.7.5
Risk
From the appRisk and diversification analysis.
Concentration risk level (largest position, largest sector, number of stocks, diversification score), advanced measures from your daily history (annual volatility, Sharpe, Sortino, max drawdown; needs at least 5 days), and a correlation matrix between your stocks over about the last 3 months (at least two stocks) with "Recalculate".
4.7.6
Simulators
From the appThe compound DCA simulator.From the appThe position-size calculator based on your risk.
Compound DCA: initial amount, monthly, expected annual return, duration (1–30 years) → total invested, compound earnings, final value, and a growth curve.
Position-size calculator: capital (or "Use portfolio value"), risk %, commission, entry, stop and target → suggested shares, max loss, cost, position size, break-even, reward-to-risk. Warnings: allowed risk smaller than one share, cost above cash, concentration, stop too close.
System effects
They save nothing to your portfolio.
4.8
Lab (Strategy Lab)
Overview
Strategy research on historical data entirely on your device, isolated from your real portfolio (its own IndexedDB; it does not touch your data, backup or sync). Its results are historical and do not guarantee the future.
Access
the "Lab" section (when the strategyLab flag is on, which it is): "Lab dashboard" and "Strategies".
Components
The dashboard: what you have (strategies, runs, datasets, running), "What needs your attention", latest runs. "Strategies" tabs: Strategies (entry, exit, size and risk rules with SMA, EMA, RSI, MACD, Bollinger, ATR… indicators, market, limit and stop orders, with a plain-language drafting assistant whose output the app verifies), Data (import daily CSV with corporate actions), Runs (set up and run, with period splits: development / validation / protected final test), Results (equity curve, trades, log, XLSX and PDF reports); and extra tabs per flags: Experiments (bounded-range optimisation with multiple-testing disclosure), Paper and Readiness (run the strategy on the Virtual Market with readiness gates), Sharing (share a version for view or copy, with revoke).
Steps
import data in "Data"
create a strategy
set up and run a test
read "Results"
to validate: walk-forward and robustness
to rehearse: the "Paper" tab.
System effects
Everything is local and stored in the lab database. There is no path to real orders. The assistant, experiments, paper trading and sharing require a signed-in cloud account (and the assistant needs the server). What you share is stored readable on the server until you revoke it; everything else stays encrypted on your device.
Tips
Each run keeps a snapshot so it can be reproduced; beware of over-optimism: many tries require disclosure.
4.9
Settings
From the appAppearance settings: theme, language, motion and profit/loss colours.
Access
"Settings" at the bottom of the side rail. Changes apply instantly and are saved on this device.
Components
Appearance: theme (auto/light/dark), language (Arabic RTL or English LTR), extra display options: motion, profit/loss colours (green/red or blue/orange for colour-blindness), high contrast, numerals (Western 123 / Arabic ١٢٣; reloads the page). Privacy: hide amounts. Defaults: value-curve range and stock sort order, and optional cards (getting-started steps, weekly review). Data and sources: price data source (a proxy server and a price file), tax defaults, anonymous crash reports (error message only), reset the virtual portfolio. Links: Privacy & Terms, Contact us, About. Danger zone: "Clear current portfolio data" and "Delete current portfolio".
System effects
Dangerous actions cannot be undone and require typing the portfolio name, with an option "Export a backup before continuing". The only portfolio cannot be deleted.
Tips
"Price data source" lets you use your own proxy (a free Cloudflare Worker) or a JSON price file; both are optional and the app works without them with lower reliability.
4.10
Account
From the appYour portfolios: switch between them and create a new one.From the appApp lock with a PIN and portfolio data encryption.
Overview
Your identity, portfolios, data and security.
Access
"Account" (bottom of the side rail, or "More" on phone).
Components
Identity card (photo, name, "Investor since", cloud account / on this device, net deposited, value, return); Your portfolios (switch between them, "New portfolio": name and portfolio market); Investor profile (name, goal, horizon, risk tolerance, preferred sector, JPG/PNG/WebP photo); Backup (export, import, reminder every N days, optional upload to Google Drive with your own OAuth Client ID); Privacy & security (hide amounts, PIN lock and encryption); Cloud account & subscription (server URL, sign in / new account, sign out, subscription status, activation code, support); Net worth; alerts and notifications; keyboard shortcuts.
Steps
App lock: "App lock (PIN) and encryption" → a 6–12 character code and its confirmation → optionally "Encrypt portfolio data" → "Save and enable lock". To remove it: "Disable lock and encryption" and enter the code.
Cloud account: enter the server URL (Worker URL) → "New account" or "Sign in" → encrypted sync begins.
Net worth: add other assets (property, car, bank account, crypto) and debts to see net worth beside your portfolios, and "Encrypted emergency export" (a file opened with a password you choose, offline).
Pro activation code: type it under "Have an activation code?" → "Activate".
System effects
Without encryption anyone opening this browser sees your portfolio. If you forget the PIN while encryption is on, encrypted data cannot be recovered except from a backup (PIN recovery may give you a recovery code; keep it). Your server data is end-to-end encrypted: the server sees no quantities or amounts.
Tips
Export backups regularly (the app reminds you). Paid subscriptions, account password reset and in-store payments are not enabled at present (the billing, accountRecovery and iap flags are off), so do not rely on them.
4.11
Stock page window
Opens when you tap a stock (from Stocks, the map, movers or alerts): tabs "Overview" (shares, buy price, value, weight, unrealised P/L, break-even, holding time, buttons Sell / Edit / Update price / Price alert / Price archive), "Ledger" (your buys, sales, dividends, alerts), "Analysis" (stock chart, technical analysis, company profile). Chart prices are delayed 15 minutes and display-only; your personal position always uses your real portfolio prices. A stock you do not own offers "Add to portfolio" or "Add to watchlist".
4.12
Sell and price-archive dialogs
From the appThe sell form: quantity, price, proceeds and realised profit.
Sell shares: quantity (not above what you own), sell price, sell commission; you see total proceeds and realised P/L → "Confirm sale". It adds proceeds to cash and logs the trade.
Daily close archive: a close price per stock for the chosen date (no future dates) → "Save today's prices". Per-stock archive: the price on a given date, average price over a period, add a manual entry or a CSV file (date and close columns), delete an entry. It supports signals and levels.
4.13
Getting-started steps and the weekly review
Overview
Two optional cards: "Get started in 3 steps" to finish setup, and "Weekly review" for your week's result.
Access
"Get started in 3 steps" appears in Stocks, and "Weekly review" in AnalysisPerformance. Show or hide them in "SettingsOptional cards".
Components
Getting started: (1) "Replace the sample data with your own": "Add a stock" or import a backup file, (2) "Set your investor profile" (tailors signal suggestions and the daily summary), (3) "Turn on the lock (PIN) and notifications". Each step shows ✓ when done, plus a "Hide" button. Weekly review: "your week in 3 figures", whose performance excludes deposits and withdrawals.
Steps
Start with step one (the rest is optional and you can return later) → press the button inside each step to open its dialog.
System effects
They change none of your figures; they only open the usual dialogs (add stock, investor profile, lock, notifications). Hiding is saved on this device.
Tips
While the data is sample data, step one reminds you: "The figures shown are sample figures".
4.14
Updates and installing on your device
Overview
The app is an installable web app ("standalone" display, named SmartBorsa) and updates itself.
Access
install from the browser menu ("Add to Home Screen / Install app"). Updates: a bar at the top of the screen.
Components
A "New version ready" bar: "Update now to get the latest improvements — your data is safe", with an "Update now" button and a "later" option.
Steps
When the bar appears press "Update now" → the page reloads on the new version.
System effects
Files are cached so the app opens fast; updating replaces them without touching the data saved in your browser.
Tips
On iPhone the app must be added to the Home Screen for notifications to work outside the app. If you see an old version after updating, reload the page twice.
4.15
Public pages: About, Contact, Privacy & Terms
Overview
Three informational and legal pages that open in a new tab.
Access
"SettingsPrivacy & Terms / Contact us / About". They are also linked from the Welcome page footer.
Components
"About us" (what SmartBorsa is and who it is for), "Contact us" (ways to reach us and to send a message or complaint), "Privacy & Terms" (what we store, encryption, disclaimer). A "Page not found" page appears for a wrong link.
System effects
Read-only; they change none of your data. Support replies to your messages appear inside "Account → Contact us" when you have a cloud account.
5Troubleshooting
What you see
Cause and fix
"Could not read … nothing changed"
Nothing in your data changed; reload the page
"No reliable data source is enabled for this market"
No price source for that market now; an operator sets it up
A page says the server is unavailable
It needs the app server; the rest of the app works locally
A return cannot be computed
Read the next step on the card (record a deposit, reconcile liquidity, add a price archive)
You see an old version after an update
The service worker caches files; reload the page twice
You forgot your PIN
Use the recovery code if you created one, otherwise import a backup